神谷&重田により設計・生産された心電図計。ソフトウェアが難点であったので,Arduino側とサーバー側,双方を再構成してみた。ハードウェアは非常に優れており,ECGは大変美しく測定できる。
Arduino側
マルチスレッド化してコア1が波形処理,コア2がHTTP通信を担当することに。
NTPを用いて時刻を取得,IBIのタイムスタンプをms単位で記録することに。
コードをメインモジュールとサブモジュールに分割
HTTP-ECG_N1_03が最新版。
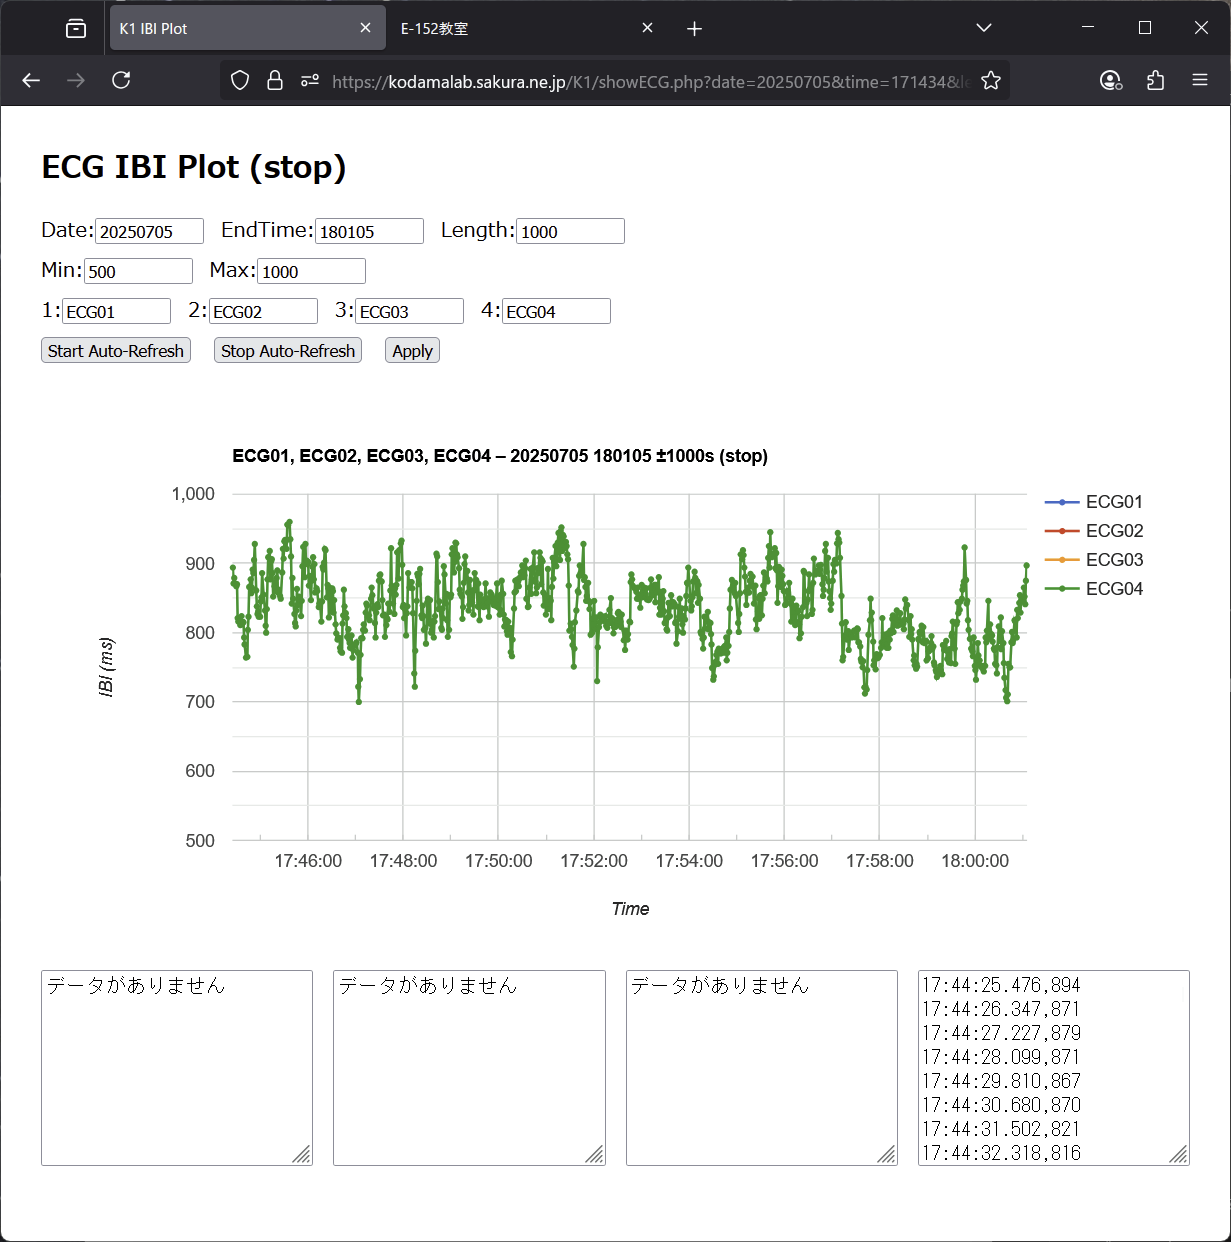
サーバー側(アクセスはここから)
4モジュール同時表示&データ回収に対応。
グラフの再描画は5秒間隔とし,グラフのリフレッシュはAJAXで行うことに。
指定した時間帯のIBIを狙って表示&取得することもできる。
今後の展開
・本体でRMSSDなどのHRVを計算し,フィードバックできるようにする
・本体フルカラーLEDを心拍に合わせて光らせる
・モードを切り替えるとUDPで心拍波形を受け取れるようにする
などの機能を追加したい。

<?php
// showECG.php
// Auto‐Refresh Start/Stop & AJAX 更新版 ECG IBI Plot(Date/EndTime セッションクッキー対応)

/* ───── CONFIGURATION ───── */
$allModules = ['ECG01','ECG02','ECG03','ECG04'];
$dataDir    = __DIR__.'/data/';
$rootDir    = __DIR__.'/';

/* ───── GET / COOKIE / DEFAULTS ───── */
// ★ まず Date/time(EndTime)をクッキー→GET→現在時刻の順で取得
$date = $_COOKIE['date'] ?? ($_GET['date'] ?? date('Ymd'));
$time = $_COOKIE['time'] ?? ($_GET['time'] ?? date('His'));

$length = isset($_GET['length']) ? intval($_GET['length']) : 600;
$min    = isset($_GET['min']) ? intval($_GET['min']) : ($_COOKIE['min'] ?? 500);
$max    = isset($_GET['max']) ? intval($_GET['max']) : ($_COOKIE['max'] ?? 1500);

/* ───── バリデーション & Cookie 保存 ───── */
if (!preg_match('/^\d{8}$/',$date)) $date = date('Ymd');
if (!preg_match('/^\d{6}$/',$time)) $time = date('His');
if ($length < 1)  $length = 600;
if ($min < 0)     $min = 0;
if ($max <= $min) $max = $min + 100;

// ★ Date/time をセッションクッキー(有効期限省略)で保存
setcookie('date', $date);
setcookie('time', $time);
// min/max は従来どおり 1 年有効
if (isset($_GET['min'])) setcookie('min', $min, time()+86400*365,'/');
if (isset($_GET['max'])) setcookie('max', $max, time()+86400*365,'/');

/* ───── Module1–4 入力処理(変更なし) ───── */
if (isset($_GET['mod1'])||isset($_GET['mod2'])||isset($_GET['mod3'])||isset($_GET['mod4'])) {
  $raw=[];
  for($i=1;$i<=4;$i++){
    $k="mod{$i}";
    if(!empty($_GET[$k]) && in_array($_GET[$k],$allModules,true)) $raw[]=$_GET[$k];
  }
  $mods=array_slice(array_unique($raw),0,4);
  setcookie('modules',implode(',',$mods),time()+86400*365,'/');
}elseif(!empty($_COOKIE['modules'])){
  $mods=array_values(array_intersect($allModules,explode(',',$_COOKIE['modules'])));
}else $mods=$allModules;
if(empty($mods)) $mods=$allModules;

/* ───── JSON エンドポイント (AJAX) ───── */
if(isset($_GET['ajax'])&&$_GET['ajax']==='1'){
  header('Content-Type: application/json');

  // EndTime 決定
  if(isset($_GET['now']) && $_GET['now']==='1'){
    $time=date('His');                // 現在時刻
  }elseif(isset($_GET['time']) && preg_match('/^\d{6}$/',$_GET['time'])){
    $time=$_GET['time'];              // 手入力時刻
  } // else: 上部で決定した $time をそのまま使用

  // ★ ajax でも最新 time をクッキー更新(セッション)
  setcookie('time', $time);

  $targetSec=intval(substr($time,0,2))*3600
            +intval(substr($time,2,2))*60
            +intval(substr($time,4,2));
  $fromSec=$targetSec-$length;

  $series=[];
  foreach($mods as $mod){
    $csv="{$mod}_{$date}.csv";
    $file=is_readable($dataDir.$csv)?$dataDir.$csv:(is_readable($rootDir.$csv)?$rootDir.$csv:null);
    $pts=[];
    if($file && ($fh=fopen($file,'r'))){
      while(($L=fgetcsv($fh))!==false){
        if(count($L)<2) continue;
        [$ts,$ibi]=$L;
        if(preg_match('/^(\d{8})_(\d{2})(\d{2})(\d{2})_(\d{3})$/',$ts,$m)){
          [$h,$i,$s,$ms]=$m;
          $h=$m[2];$i=$m[3];$s=$m[4];$ms=$m[5];
          $sec=intval($h)*3600+intval($i)*60+intval($s);
          if($sec>=$fromSec && $sec<=$targetSec){
            $dt=DateTime::createFromFormat('YmdHisv',$m[1].$h.$i.$s.$ms);
            $epoch=((int)$dt->format('U'))*1000+intval($ms);
            $pts[]=['ts_ms'=>$epoch,'y'=>floatval($ibi)];
          }
        }
      }
      fclose($fh);
    }
    $series[$mod]=$pts;
  }

  echo json_encode([
    'date'=>$date,'time'=>$time,'length'=>$length,
    'min'=>$min,'max'=>$max,'mods'=>$mods,'series'=>$series
  ]);
  exit;
}
?>
<!DOCTYPE html>
<html>
<head>
<meta charset="utf-8">
<title>K1 IBI Plot</title>
<script src="https://www.gstatic.com/charts/loader.js"></script>
<style>
 body{font-family:sans-serif;margin:2em;}
 form{margin-bottom:1em;}
 .row{display:flex;align-items:center;margin-bottom:0.5em;}
 .row input{width:6em;margin-right:1em;}
 button{margin-right:1em;}
 .textarea-container{display:flex;gap:1em;margin-top:1em;}
 .textarea-container textarea{flex:1;height:150px;}
</style>
</head>
<body>
<h2 id="pageTitle">ECG IBI Plot (refresh)</h2>

<form id="cfgForm">
  <div class="row">
    Date:     <input name="date" value="<?php echo $date ?>">
    EndTime:  <input name="time" value="<?php echo $time ?>" id="endTimeField">
    Length:   <input name="length" value="<?php echo $length ?>">
  </div>
  <div class="row">
    Min: <input name="min" value="<?php echo $min ?>">
    Max: <input name="max" value="<?php echo $max ?>">
  </div>
  <div class="row">
    1: <input name="mod1" value="<?php echo $mods[0]??'' ?>">
    2: <input name="mod2" value="<?php echo $mods[1]??'' ?>">
    3: <input name="mod3" value="<?php echo $mods[2]??'' ?>">
    4: <input name="mod4" value="<?php echo $mods[3]??'' ?>">
  </div>
  <button type="button" id="startBtn">Start Auto-Refresh</button>
  <button type="button" id="stopBtn">Stop Auto-Refresh</button>
  <button type="button" id="applyBtn">Apply</button>
</form>

<div id="chart_div" style="width:100%;height:450px;"></div>

<div class="textarea-container">
  <textarea name="text1" placeholder="Module1"></textarea>
  <textarea name="text2" placeholder="Module2"></textarea>
  <textarea name="text3" placeholder="Module3"></textarea>
  <textarea name="text4" placeholder="Module4"></textarea>
</div>

<script>
google.charts.load('current',{packages:['corechart']});
let chart,dataTable,options;
let statusLabel='(refresh)',intervalId=null;

/* === fetch === */
async function fetchData(auto){
  const p=new URLSearchParams(new FormData(document.getElementById('cfgForm')));
  p.set('ajax','1');
  if(auto){ p.set('now','1'); p.delete('time'); }
  const r=await fetch('showECG.php?'+p);
  return r.json();
}

/* === init === */
function initChart(json){
  dataTable=new google.visualization.DataTable();
  dataTable.addColumn('datetime','Time');
  json.mods.forEach(m=>dataTable.addColumn('number',m));
  new google.visualization.DateFormat({pattern:'HH:mm:ss'}).format(dataTable,0);

  options={
    title:'',
    hAxis:{title:'Time',format:'HH:mm:ss'},
    vAxis:{title:'IBI (ms)'},
    legend:{position:'right'},
    pointSize:3,
    explorer:{actions:['dragToZoom','rightClickToReset'],axis:'horizontal'}
  };
  chart=new google.visualization.LineChart(document.getElementById('chart_div'));
  updateChart(json);
}

/* === update === */
function updateChart(json){
  document.getElementById('endTimeField').value=json.time;

  const n=dataTable.getNumberOfRows();
  if(n) dataTable.removeRows(0,n);

  const map={};
  json.mods.forEach(m=>{
    json.series[m].forEach(pt=>{
      if(!map[pt.ts_ms]) map[pt.ts_ms]={};
      map[pt.ts_ms][m]=pt.y;
    });
  });

  Object.keys(map).map(Number).sort((a,b)=>a-b).forEach(ts=>{
    const row=[new Date(ts)];
    json.mods.forEach(m=>row.push(map[ts][m]??null));
    dataTable.addRow(row);
  });

  options.title=`${json.mods.join(', ')} – ${json.date} ${json.time} ±${json.length}s ${statusLabel}`;
  options.vAxis.viewWindow={min:json.min,max:json.max};
  document.getElementById('pageTitle').textContent='ECG IBI Plot '+statusLabel;
  chart.draw(dataTable,options);

  const areas=['text1','text2','text3','text4'];
  for(let i=0;i<4;i++){
    const ta=document.getElementsByName(areas[i])[0];
    if(i>=json.mods.length){ ta.value='データがありません'; continue; }
    const mod=json.mods[i];
    const lines=Object.keys(map).map(Number).sort((a,b)=>a-b).flatMap(ts=>{
      const ibi=map[ts][mod];
      if(ibi==null) return [];
      const d=new Date(ts);
      const hh=`${d.getHours()}`.padStart(2,'0');
      const mm=`${d.getMinutes()}`.padStart(2,'0');
      const ss=`${d.getSeconds()}`.padStart(2,'0');
      const ms=`${d.getMilliseconds()}`.padStart(3,'0');
      return `${hh}:${mm}:${ss}.${ms},${ibi}`;
    });
    ta.value=lines.length?lines.join('\n'):'データがありません';
  }
}

/* === control === */
function startAutoRefresh(){
  if(intervalId) return;
  statusLabel='(refresh)';
  fetchData(true).then(process);
  intervalId=setInterval(()=>fetchData(true).then(process),5000);
}
function stopAutoRefresh(){
  if(!intervalId) return;
  clearInterval(intervalId);
  intervalId=null;
  statusLabel='(stop)';
  fetchData(false).then(process);
}
function process(j){ chart?updateChart(j):initChart(j); }

document.getElementById('startBtn').onclick=startAutoRefresh;
document.getElementById('stopBtn').onclick=stopAutoRefresh;
document.getElementById('applyBtn').onclick=()=>{
  stopAutoRefresh();
  fetchData(false).then(process);
};

/* === onload === */
google.charts.setOnLoadCallback(async ()=>{
  const j=await fetchData(true);
  initChart(j);
  startAutoRefresh();
});
</script>
</body>
</html>